Global Happiness 2023
A 32-country Global Advisor survey
GLOBAL HAPPINESS 2023 Life Satisfaction Across the World A 32-country Global Advisor survey March 2023
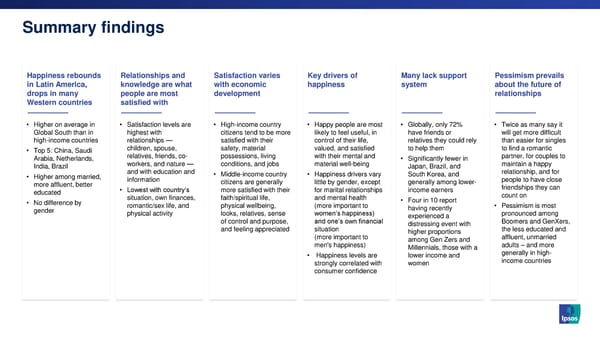
Summary findings Happiness rebounds Relationships and Satisfaction varies Key drivers of Many lack support Pessimism prevails in Latin America, knowledge are what with economic happiness system about the future of drops in many people are most development relationships Western countries satisfied with • Higher on average in • Satisfaction levels are • High-income country • Happy people are most • Globally, only 72% • Twice as many say it Global South than in highest with citizens tend to be more likely to feel useful, in have friends or will get more difficult high-income countries relationships — satisfied with their control of their life, relatives they could rely than easier for singles • Top 5: China, Saudi children, spouse, safety, material valued, and satisfied to help them to find a romantic Arabia, Netherlands, relatives, friends, co- possessions, living with their mental and • Significantly fewer in partner, for couples to India, Brazil workers, and nature — conditions, and jobs material well-being Japan, Brazil, and maintain a happy • Higher among married, and with education and • Middle-income country • Happiness drivers vary South Korea, and relationship, and for more affluent, better information citizens are generally little by gender, except generally among lower- people to have close educated • Lowest with country’s more satisfied with their for marital relationships income earners friendships they can situation, own finances, faith/spiritual life, and mental health • Four in 10 report count on • No difference by romantic/sex life, and physical wellbeing, (more important to having recently • Pessimism is most gender physical activity looks, relatives, sense women’s happiness) experienced a pronounced among of control and purpose, and one’s own financial distressing event with Boomers and GenXers, and feeling appreciated situation higher proportions the less educated and (more important to among Gen Zers and affluent, unmarried men's happiness) Millennials, those with a adults – and more • Happiness levels are lower income and generally in high- strongly correlated with women income countries consumer confidence
1 Level of happiness by country
Happiness across the world % Happy (very/rather) DE67% NL85% SE74% GB70% PL58% CA74% BE68% FR74% HU50% KR57% US76% ES69% TR61% JP60% PT79% IT 68% CN91% MX81% SA86% AE 81% IN84% MY68% CO80% TH71% PE72% BR83% SG71% ID 79% AU 80% CL79% ZA77% AR 74%
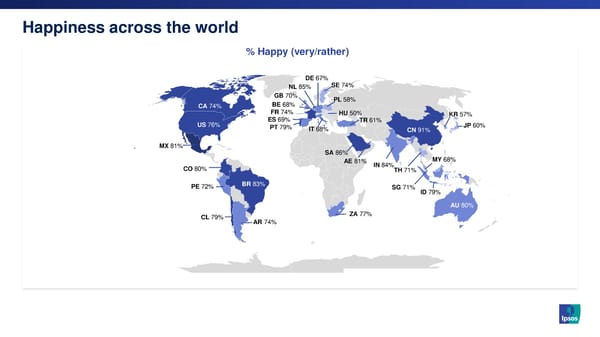
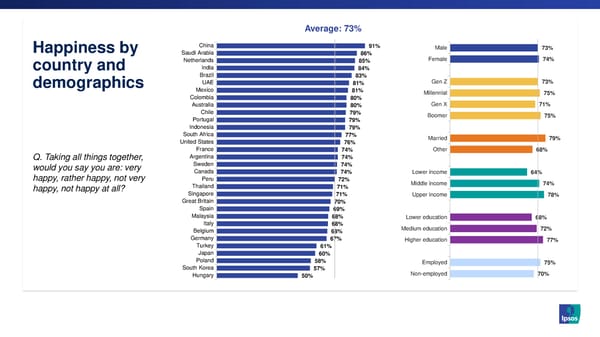
Average: 73% China 91% Happiness by China 91% Male 73% Saudi Arabia 86% Saudi Arabia 86% Netherlands 85% Female 74% Netherlands 85% India 84% country and India 84% Brazil 83% Brazil 83% UAE 81% Gen Z 73% demographics UAE 81% Mexico 81% Mexico 81% Millennial 75% Colombia 80% Colombia 80% Australia 80% Gen X 71% Australia 80% Chile 79% Chile 79% Portugal 79% Boomer 75% Portugal 79% Indonesia 79% Indonesia 79% South Africa 77% South Africa 77% United States 76% Married 79% United States 76% France 74% France 74% Other 68% Argentina 74% Argentina 74% Q. Taking all things together, Sweden 74% Sweden 74% would you say you are: very Canada 74% Canada 74% Lower income Peru 72% 64% happy, rather happy, not very Peru Thailand 72% 71% Middle income 74% Thailand Singapore 71% happy, not happy at all? 71% Great Britain Singapore 70% 71% Upper income 78% Spain Great Britain 69% 70% Malaysia 68% Spain 69% Italy 68% Malaysia 68% Lower education 68% Belgium 68% Italy 68% Medium education 72% Germany 67% Belgium 68% Turkey 61% Germany 67% Higher education 77% Japan 60% Turkey 61% Poland 58% Japan 60% South Korea 57% Poland 58% Employed 75% Hungary South Korea 50%57% Hungary 50% Non-employed 70%
Dec 2011 May 2013 Mar 2017 Feb 2018 Jun 2019 Aug 2020 Dec 2021 Jan 2023 1- year 10-year Change in change change Global Country 77% 77% 61% 70% 64% 63% 67% 73% +6 -4 Average happiness China 78% 79% 84% 85% 82% 93% 83% 91% +8 +12 Saudi Arabia 83% 74% 75% 76% 78% 80% 81% 86% +5 +12 Netherlands 87% 86% 85% -1 n/a level by India 89% 87% 78% 83% 77% 66% 82% 84% +2 -3 Brazil 77% 81% 56% 73% 61% 63% 63% 83% +20 +2 country UAE 81% n/a n/a Mexico 78% 80% 43% 67% 59% 46% 65% 81% +16 +1 Colombia 32% 58% 54% 80% +26 n/a Australia 86% 84% 72% 82% 86% 77% 85% 80% -5 -4 Chile 41% 71% 50% 35% 53% 79% +26 n/a Indonesia 79% n/a n/a Portugal 79% n/a n/a South Africa 79% 83% 59% 72% 59% 52% 65% 77% +12 -6 Q. Taking all things together, United States 85% 83% 80% 82% 79% 70% 76% 76% -0 -7 would you say you are: very Argentina 68% 67% 48% 56% 34% 43% 48% 74% +26 +7 France 84% 81% 68% 77% 80% 78% 81% 74% -7 -7 happy, rather happy, not very Sweden 80% 87% 74% 81% 75% 74% 78% 74% -4 -13 happy, not happy at all? Canada 85% 83% 81% 81% 86% 78% 80% 74% -6 -9 Peru 36% 54% 58% 32% 54% 72% +18 n/a Thailand 71% n/a n/a Singapore 72% 71% -1 n/a % Happy (very/rather) Great Britain 79% 81% 71% 78% 82% 76% 83% 70% -13 -11 Spain 63% 57% 43% 53% 46% 38% 55% 69% +14 +12 Malaysia 69% 52% 62% 65% 68% +3 n/a Italy 73% 68% 53% 60% 57% 62% 66% 68% +2 +0 Belgium 80% 80% 71% 80% 73% 71% 73% 68% -5 -12 Germany 76% 77% 71% 68% 78% 73% 72% 67% -5 -10 Turkey 89% 83% 58% 60% 53% 59% 42% 61% +19 -22 Japan 70% 69% 62% 60% 52% 55% 58% 60% +2 -9 Poland 75% 72% 66% 71% 71% 68% 65% 58% -7 -14 South Korea 71% 62% 48% 57% 54% 54% 57% 57% +0 -5 Hungary 43% 52% 48% 48% 50% 45% 51% 50% -1 -2
Happiness North America + Australia Latin America Europe Asia Middle-East/Africa trends by world 100% regions 90% 80% 70% Q. Taking all things together, would you say you are: very 60% happy, rather happy, not very happy, not happy at all? 50% % Happy (very/rather) 40% 30% Dec May Mar Feb Jun Aug Dec Jan 2011 2013 2017 2018 2019 2020 2021 2023
Happiness High-income countries Medium-income countries trends by level 100% of economic 90% development 80% 70% Q.Taking all things together, would you say you are: very happy, rather happy, not 60% very happy, not happy at all? % Happy (very/rather) 50% Based on World Bank country classification by income level for 2022-2023 40% • High-income countries: Australia, Belgium, Canada, Chile, France, Germany, Great Britain, Hungary, Italy, Japan, South Korea, Netherlands, Poland, Portugal, Saudi Arabia, 30% Singapore, Spain, Sweden, UAE, United States Dec May Mar Feb Jun Aug Dec Jan • Middle-income (upper or lower) countries: 2011 2013 2017 2018 2019 2020 2021 2023 Argentina, Brazil, China, Colombia, India, Indonesia, Mexico, Malaysia, Peru, Thailand, Turkey, South Africa
2 Satisfaction with aspects of life
My children (if a parent) 85% Satisfaction with Relationship with partner/spouse (if has one) 84% Access to /in touch with nature 80% aspects of life: Level of education 80% Relationship with relatives 78% Global average Friends 78% Access to news/information 77% Co-workers (if employed) 77% Feeling loved 76% Feeling free to do and say what I want 76% Personal safety and security 75% Access to entertainment/leisure activities 75% Job (if employed) 74% Religious faith or spiritual life 74% Q. Overall, how satisfied are Living conditions 74% Amount of free time 74% you with each of the following Looks 73% aspects of your life: Feeling in control of my life 73% Feeling my life has meaning 73% Feeling appreciated 73% % Satisfied (very/somewhat) Mental health and well-being 72% Material possessions 72% Physical health and well-being 72% Social status 72% Social life 71% Exercising/physical activities 65% Romantic/sex life 63% Own financial situation 57% Country's economic situation 40% Country's social and political situation 40%
Satisfaction with aspects of life by country y r t a a s n in s ia e u a d b ic e t a e r r a a a y it ia n l r r f t Co e in a i n y s ia la a o n d S l t li m a b Br r A A Ko n g a d e a a e s o r d g i p e a y d a a n r iu a e a m c t g n n y ic e n u a h h d e e b r e t g zil o n m a ia o a la x h u t d g t t in e il k E o e g s a il in l a r e n d d ly p a e r la r u u u a a r it v r u r a a e o o a in o o p w h u Gl A A A Bel Br Can Ch Ch Co F Ge Gr Hu In In It J M M Net P P P S S S S S S T T UA Un My children (if a parent) 85% 79% 87% 84% 74% 87% 82% 88% 83% 84% 84% 86% 82% 86% 97% 80% 76% 94% 84% 90% 79% 90% 98% 83% 86% 80% 78% 83% 83% 92% 82% 91% 84% Relationship with partner/spouse (if has one) 84% 88% 87% 83% 78% 83% 82% 89% 87% 81% 77% 85% 84% 84% 94% 76% 70% 90% 85% 94% 86% 79% 88% 88% 83% 86% 73% 87% 79% 90% 80% 85% 86% Access to/in touch with nature 80% 82% 84% 83% 71% 81% 76% 86% 84% 80% 79% 81% 78% 84% 87% 70% 62% 82% 88% 87% 76% 81% 92% 87% 75% 78% 56% 82% 80% 88% 66% 85% 81% Level of education 80% 89% 87% 76% 73% 80% 85% 85% 84% 78% 83% 77% 70% 84% 89% 73% 50% 82% 84% 89% 79% 72% 90% 88% 77% 74% 60% 86% 74% 91% 77% 88% 79% Relationship with relatives 78% 78% 78% 66% 72% 76% 80% 86% 84% 74% 71% 79% 77% 85% 91% 71% 57% 86% 86% 82% 85% 76% 83% 80% 79% 78% 64% 79% 70% 87% 77% 91% 74% Friends 78% 86% 81% 75% 74% 74% 79% 89% 75% 77% 77% 78% 65% 79% 85% 74% 54% 82% 79% 86% 78% 72% 87% 87% 84% 74% 56% 80% 74% 89% 76% 85% 78% Access to news/information 77% 73% 83% 75% 70% 81% 67% 86% 71% 73% 77% 80% 61% 82% 97% 70% 70% 87% 80% 89% 71% 78% 79% 85% 85% 83% 58% 69% 82% 88% 71% 82% 74% Co-workers (if employed) 77% 73% 83% 73% 73% 79% 76% 86% 80% 71% 75% 76% 70% 82% 85% 67% 51% 79% 81% 84% 79% 73% 79% 87% 79% 72% 58% 77% 79% 82% 78% 88% 75% Feeling loved 76% 84% 75% 64% 72% 75% 83% 84% 80% 70% 75% 73% 73% 82% 87% 73% 49% 80% 76% 90% 83% 69% 83% 81% 75% 76% 53% 82% 72% 76% 69% 82% 77% Feeling free to do and say what I want 76% 80% 80% 69% 72% 76% 81% 86% 79% 72% 73% 75% 59% 76% 80% 74% 58% 71% 84% 86% 80% 61% 89% 86% 79% 79% 58% 78% 74% 87% 57% 83% 78% Personal safety and security 75% 63% 87% 69% 63% 83% 61% 88% 67% 69% 78% 75% 70% 80% 91% 71% 60% 83% 77% 88% 63% 71% 85% 91% 91% 64% 66% 77% 72% 84% 59% 88% 75% Access to entertainment/leisure activities 75% 77% 80% 68% 71% 77% 74% 85% 76% 71% 78% 76% 55% 83% 85% 69% 51% 83% 81% 86% 78% 69% 77% 82% 74% 75% 57% 78% 69% 86% 57% 84% 76% Job (if employed) 74% 72% 81% 72% 67% 73% 79% 82% 80% 68% 75% 74% 65% 80% 76% 71% 47% 75% 85% 88% 76% 70% 75% 83% 70% 67% 56% 77% 73% 83% 74% 90% 74% Religious faith or spiritual life 74% 76% 70% 66% 73% 71% 76% 79% 84% 65% 67% 64% 64% 84% 93% 66% 42% 88% 78% 84% 73% 68% 76% 85% 79% 80% 50% 71% 71% 89% 72% 91% 76% Living conditions 74% 74% 86% 66% 68% 73% 75% 86% 77% 76% 76% 79% 54% 78% 79% 70% 57% 79% 80% 86% 75% 65% 81% 81% 81% 71% 54% 75% 68% 81% 57% 85% 77% Amount of free time 74% 70% 78% 71% 75% 76% 75% 80% 74% 74% 75% 75% 64% 79% 90% 69% 64% 80% 77% 82% 69% 66% 65% 79% 75% 71% 55% 73% 80% 87% 64% 80% 77% Looks 73% 83% 67% 65% 64% 71% 80% 80% 81% 70% 73% 67% 60% 83% 84% 69% 40% 80% 82% 80% 82% 61% 81% 88% 72% 79% 50% 79% 67% 85% 76% 84% 69% Feeling in control of my life 73% 78% 75% 65% 68% 67% 77% 83% 82% 65% 72% 65% 67% 81% 87% 69% 45% 78% 82% 79% 86% 61% 85% 87% 70% 70% 56% 72% 63% 89% 66% 84% 70% Feeling my life has meaning 73% 76% 74% 61% 68% 67% 81% 85% 79% 66% 70% 68% 58% 81% 85% 68% 51% 83% 82% 83% 82% 67% 84% 84% 74% 77% 34% 73% 67% 91% 62% 86% 73% Feeling appreciated 73% 85% 70% 67% 68% 70% 79% 87% 84% 71% 67% 66% 49% 84% 87% 69% 40% 70% 79% 87% 79% 59% 76% 84% 75% 71% 50% 80% 66% 83% 65% 84% 71% Mental health and well-being 72% 79% 74% 63% 67% 70% 73% 87% 75% 72% 64% 69% 56% 81% 85% 72% 47% 77% 80% 84% 77% 62% 72% 87% 70% 72% 55% 75% 67% 82% 66% 85% 71% Material possessions 72% 68% 81% 79% 75% 80% 74% 77% 76% 79% 69% 78% 39% 80% 72% 68% 60% 75% 80% 87% 69% 56% 77% 81% 75% 64% 39% 77% 79% 72% 59% 81% 79% Physical health and well-being 72% 81% 68% 58% 69% 63% 72% 87% 79% 67% 69% 65% 67% 79% 89% 68% 45% 81% 79% 76% 74% 59% 68% 86% 74% 70% 52% 75% 64% 83% 69% 86% 70% Social status 72% 72% 77% 65% 65% 72% 76% 77% 77% 71% 73% 70% 52% 80% 81% 68% 37% 80% 77% 89% 76% 64% 72% 89% 72% 71% 42% 72% 75% 82% 61% 87% 70% Social life 71% 76% 72% 64% 67% 69% 77% 83% 75% 66% 71% 65% 56% 79% 83% 65% 47% 78% 80% 84% 74% 65% 70% 86% 74% 69% 48% 74% 72% 88% 58% 83% 68% Exercising/physical activities 65% 67% 71% 55% 58% 57% 60% 83% 71% 65% 58% 62% 47% 85% 77% 61% 45% 73% 72% 78% 66% 52% 56% 83% 64% 59% 47% 64% 52% 81% 62% 83% 62% Romantic/sex life 63% 67% 61% 58% 60% 58% 73% 79% 73% 61% 60% 58% 56% 69% 75% 60% 34% 57% 68% 70% 71% 60% 64% n/a 66% 65% 44% 72% 55% 75% 63% n/a 60% Own financial situation 57% 41% 60% 47% 54% 58% 53% 78% 61% 55% 56% 56% 37% 73% 65% 57% 37% 60% 60% 80% 58% 43% 61% 76% 53% 42% 38% 61% 49% 75% 52% 82% 51% Country’s economic situation 40% 15% 54% 25% 37% 41% 24% 78% 33% 28% 50% 19% 22% 70% 53% 32% 22% 49% 47% 45% 22% 24% 12% 85% 67% 24% 21% 35% 33% 51% 31% 82% 34% Country’s social and political situation 40% 17% 60% 24% 43% 44% 26% 83% 38% 32% 42% 27% 20% 72% 53% 34% 28% 59% 55% 47% 24% 27% 21% n/a 71% 25% 23% 38% 30% 55% 37% n/a 35%
Life aspects ranked by satisfaction level – top 10 by country y r t a a s n in s ia e u a d b ic e t a e r r a a a y it ia n l r r f t Co e in a i n y s ia la a o n d S l t li m a b Br r A A Ko n g a d e a a e s o r d g i p e a y d a a n r iu a e a m c t g n n y ic e n u a h h d e e b r e t g zil o n m a ia o a la x h u t d g t t in e il k E o e g s a il in l a r e n d d ly p a e r la r u u u a a r it v r u r a a e o o a in o o p w h u Gl A A A Bel Br Can Ch Ch Co F Ge Gr Hu In In It J M M Net P P P S S S S S S T T UA Un My children (if a parent) 1 2 1 4 1 4 3 7 1 1 1 2 1 1 1 1 1 7 2 10 1 1 2 4 1 3 1 1 1 1 2 Relationship with partner/spouse (if has one) 2 2 1 3 1 2 3 2 1 2 6 2 1 4 3 2 2 2 3 1 1 3 5 3 5 1 2 1 6 4 2 1 Access to/in touch with nature 3 7 6 2 4 3 3 3 3 3 6 10 5 10 1 10 2 2 10 8 10 5 3 8 3 Level of education 3 1 3 5 6 6 1 2 5 2 9 8 6 8 5 10 6 4 9 8 3 5 5 2 9 2 4 6 4 Relationship with relatives 5 9 8 8 5 9 5 4 2 5 9 9 5 2 3 5 7 7 4 8 4 2 Friends 6 3 9 6 5 1 6 8 8 4 9 7 6 6 4 7 6 7 7 Access to news/information 7 8 6 5 9 10 7 4 2 3 4 5 4 3 2 8 2 9 10 Co-workers (if employed) 8 7 8 8 8 10 10 10 6 10 6 9 8 6 5 3 5 Feeling loved 9 5 2 10 5 5 3 4 10 10 4 8 Feeling free to do and say what I want 10 9 9 10 6 3 8 5 7 4 10 5 6 10 10 6 Personal safety and security 11 4 3 4 5 7 5 9 7 7 7 9 7 1 1 3 7 Access to entertainment/leisure activities 12 9 4 10 6 9 Job (if employed) 13 10 9 9 8 4 8 10 10 8 4 Religious faith or spiritual life 14 6 4 4 4 3 9 3 7 9 3 Living conditions 15 5 7 9 6 10 6 9 Amount of free time 15 10 3 8 7 4 4 9 Looks 17 6 7 9 9 8 5 3 6 9 6 Feeling in control of my life 18 8 10 9 2 7 7 5 Feeling my life has meaning 19 5 8 10 5 9 9 3 9 Feeling appreciated 20 4 9 6 6 8 8 6 Mental health and well-being 21 10 5 7 7 Material possessions 22 4 2 6 4 7 6 9 7 5 Social status 23 6 2 8 8 My physical health and well-being 23 8 7 9 9 9 Social life 25 10 Exercising/physical activities 26 3 Romantic/sex life 27 Own financial situation 28 Country’s social and political situation 29 Country’s economic situation 29
Personal safety and security 10 Material possessions 7 Relative satisfaction higher in Satisfaction with Living conditions 5 high-income countries Job (if employed) 4 aspects of life Social status 3 Feeling free to do and say what I want 3 and level of Access to /in touch with nature 3 Amount of free time 2 development Co-workers (if employed) 2 Friends 2 My children (if a parent) 2 Access to news/information 1 Level of education 1 Economic situation 1 Difference between high-income Feeling loved 0 and middle-income countries in Financial situation 0 Access to entertainment/leisure activities 0 rank of life aspects based on % Romantic/sex life 0 satisfied with each of them Social life -1 Social and political situation -1 Relationship with partner/spouse (if has one) -1 Mental health and well-being -2 Exercising/physical activities -3 Relationship with relatives -5 Feeling appreciated -5 Feeling my life has meaning -5 Relative satisfaction higher in Feeling in control of my life -5 Middle-income countries Looks -6 My physical health and well-being -6 Religious faith or spiritual life -7
Satisfaction with aspects of life by demographics Gender Generation Marital Status Household Income Education Employment Status l r d d y e ia e e e l r g le n d m r y y a t a a Z n X m ie r r le r r e lo o b n r o r e d e iu h p - l o u e le m n le n r h we p we d n p v a e il Bo a o id o e m m GlCo A M F Ge M Ge M Ot L M Up L M Hig E Noe My children (if a parent) 85% 84% 85% 66% 89% 89% 89% 90% 75% 74% 86% 88% 79% 82% 89% 87% 74% Relationship with partner/spouse (if has one) 84% 85% 83% 82% 85% 83% 85% 84% 82% 80% 82% 87% 81% 83% 86% 84% 83% Access to /in touch with nature 80% 80% 79% 75% 79% 80% 86% 84% 76% 75% 80% 82% 77% 79% 82% 80% 78% Level of education 80% 80% 80% 77% 79% 80% 85% 84% 76% 73% 80% 85% 70% 76% 88% 81% 77% Relationship with relatives 78% 79% 78% 77% 79% 79% 78% 82% 75% 71% 79% 82% 72% 77% 82% 80% 75% Friends 78% 77% 78% 74% 77% 78% 83% 83% 73% 70% 78% 83% 73% 76% 81% 79% 75% Access to news/information 77% 77% 78% 74% 77% 79% 81% 82% 74% 71% 78% 81% 76% 76% 80% 78% 76% Co-workers (if employed) 77% 77% 76% 75% 77% 76% 79% 80% 74% 69% 77% 80% 70% 76% 79% 77% - Feeling loved 76% 75% 76% 73% 76% 75% 80% 83% 70% 67% 77% 80% 71% 75% 79% 77% 73% Feeling free to do and say what I want 76% 76% 75% 73% 74% 75% 81% 79% 73% 72% 76% 78% 73% 74% 78% 77% 73% Personal safety and security 75% 76% 74% 73% 75% 75% 79% 81% 70% 69% 75% 79% 70% 73% 80% 76% 74% Access to entertainment/leisure activities 75% 76% 73% 73% 76% 73% 77% 78% 72% 66% 76% 79% 69% 73% 78% 77% 70% Job (if employed) 74% 74% 75% 73% 74% 74% 79% 79% 70% 66% 74% 78% 69% 74% 77% 74% - Religious faith or spiritual life 74% 74% 74% 72% 74% 75% 75% 78% 71% 70% 73% 79% 71% 72% 77% 76% 70% Living conditions 74% 74% 74% 73% 73% 72% 80% 80% 69% 64% 74% 79% 68% 72% 78% 76% 70% Amount of free time 74% 74% 74% 70% 71% 72% 85% 78% 71% 72% 75% 74% 73% 74% 74% 72% 78% Looks 73% 75% 72% 72% 74% 73% 76% 78% 70% 67% 74% 77% 69% 72% 77% 76% 69% Feeling in control of my life 73% 73% 73% 70% 73% 73% 79% 79% 68% 66% 73% 78% 68% 72% 76% 76% 69% Feeling my life has meaning 73% 74% 72% 69% 73% 74% 77% 80% 67% 64% 74% 78% 69% 72% 76% 75% 69% Feeling appreciated 73% 73% 72% 69% 73% 71% 77% 79% 67% 63% 74% 77% 69% 70% 77% 74% 69% Mental health and well-being 72% 75% 70% 67% 72% 72% 79% 79% 67% 65% 71% 78% 67% 71% 76% 74% 69% Material possessions 72% 72% 72% 70% 72% 70% 77% 78% 67% 65% 73% 75% 67% 71% 75% 73% 69% Physical health and well-being 72% 73% 70% 69% 73% 72% 72% 77% 67% 65% 72% 76% 68% 70% 75% 74% 66% Social status 72% 72% 71% 68% 71% 72% 76% 79% 66% 63% 72% 77% 66% 70% 76% 75% 66% Social life 71% 72% 71% 69% 72% 70% 74% 78% 66% 63% 72% 77% 67% 70% 74% 74% 65% Exercising/physical activities 65% 69% 61% 65% 66% 63% 66% 71% 60% 59% 65% 69% 61% 62% 70% 68% 59% Romantic/sex life 63% 63% 63% 59% 68% 62% 61% 75% 54% 52% 64% 70% 57% 63% 66% 67% 55% Own financial situation 57% 60% 55% 56% 59% 55% 60% 66% 50% 44% 56% 67% 48% 55% 64% 61% 49% Economic situation 40% 43% 36% 44% 45% 35% 32% 46% 34% 38% 38% 44% 36% 35% 46% 43% 33% Social and political situation 40% 43% 37% 44% 44% 36% 32% 45% 36% 37% 39% 44% 36% 37% 44% 43% 34%
Life aspects ranked by satisfaction level – top 10 by country Gender Generation Marital Status Household Income Education Employment Status e ial r ed ed y e m y y r n al t ag ale Z X m ied le iu er lo lo b n len o r er d er h p - p u er ale il ar h wer id p wer ed n o v em Bo o p o ig m o GloC A M F Gen M Gen M Ot L M U L M H E N em My children (if a parent) 1 2 1 1 1 1 1 4 3 1 1 2 2 1 1 9 Relationship with partner/spouse (if has one) 2 1 2 1 2 2 3 2 1 1 2 2 1 1 3 2 1 Access to /in touch with nature 3 3 4 4 3 4 2 3 2 2 3 5 3 3 5 4 2 Level of education 3 4 3 2 5 3 4 3 2 4 4 3 7 2 3 4 Relationship with relatives 5 5 7 3 4 6 7 5 8 5 5 8 4 4 5 6 Friends 6 6 5 6 6 7 6 5 8 9 6 4 6 5 6 6 7 Access to news/information 7 8 6 7 8 5 8 8 6 7 7 7 4 7 8 7 5 Co-workers (if employed) 8 7 8 4 6 8 7 9 9 5 9 Feeling loved 9 8 9 10 9 6 8 8 9 9 10 8 10 Feeling free to do and say what I want 10 9 10 8 10 7 9 6 10 7 10 9 10 Personal safety and security 11 9 9 9 7 8 Access to entertainment/leisure activities 12 9 10 10 Job (if employed) 13 9 Religious faith or spiritual life 14 10 10 Amount of free time 15 5 5 5 3 Living conditions 15 10 10 10 Looks 17 Feeling in control of my life 18 Feeling my life has meaning 19 Feeling appreciated 20 Mental health and well-being 21 Material possessions 22 Physical health and well-being 23 Social status 23 Social life 25 Exercising/physical activities 26 Romantic/sex life 27 Own financial situation 28 Country’s social and political situation 29 Country’s economic situation 29
3 Drivers of happiness
Feeling my life has meaning 0.529 Key drivers of Feeling in control of my life 0.527 Mental health and well-being 0.521 happiness Social life 0.519 Living conditions 0.507 Social status 0.503 Feeling appreciated 0.493 My financial situation 0.492 Material possessions 0.478 Feeling loved 0.473 Physical health and well-being 0.458 Feeling free to do and say what I want 0.451 Access to entertainment/leisure activities 0.449 Romantic/sex life 0.433 Correlation between satisfaction Job 0.432 with each aspect of life and Looks 0.431 reported happiness Personal safety and security 0.420 Friends 0.413 Exercising/physical activities 0.396 Co-workers 0.383 Relationship with partner/spouse 0.376 Religious faith or spiritual life 0.374 Relationship with relatives 0.371 Access to /in touch with nature 0.364 Level of education 0.363 Country's economic situation 0.361 The amount of free time I have 0.357 Country's social/political situation 0.350 Access to news/information 0.331 My children 0.289
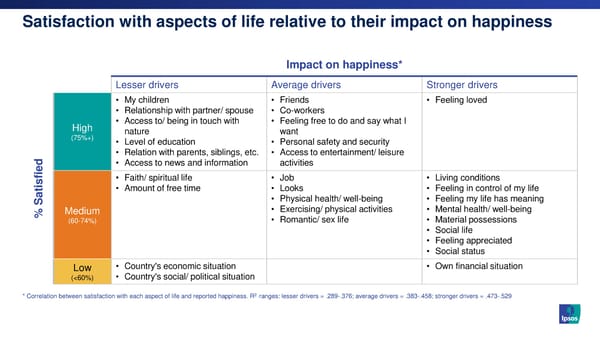
Satisfaction with aspects of life relative to their impact on happiness Impact on happiness* Lesser drivers Average drivers Stronger drivers • My children • Friends • Feeling loved • Relationship with partner/ spouse • Co-workers High • Access to/ being in touch with • Feeling free to do and say what I (75%+) nature want • Level of education • Personal safety and security • Relation with parents, siblings, etc. • Access to entertainment/ leisure • Access to news and information activities • Faith/ spiritual life • Job • Living conditions tisfied • Amount of free time • Looks • Feeling in control of my life Sa • Physical health/ well-being • Feeling my life has meaning Medium • Exercising/ physical activities • Mental health/ well-being % (60-74%) • Romantic/ sex life • Material possessions • Social life • Feeling appreciated • Social status Low • Country's economic situation • Own financial situation (<60%) • Country's social/ political situation 2 . * Correlation between satisfaction with each aspect of life and reported happiness. R ranges: lesser drivers = .289-.376; average drivers = .383-.458; stronger drivers = .473-.529
RANK AMONG: Women Men Relationship with partner/spouse 19 28 +9 Gender Mental health/well-being 2 8 +6 More important to Feeling loved 7 11 +4 women’s happiness differences on Feeling my life has meaning 1 5 +4 Access to /in touch with nature 23 26 +3 Living conditions 5 7 +2 drivers of Physical health/well-being 10 12 +2 Romantic/sex life 14 16 +2 happiness My level of education 24 25 +1 Faith or spiritual life 21 22 +1 Access to entertainment/leisure activities 12 13 +1 My children 30 30 0 Friends 18 18 0 Looks 15 15 0 Difference between rank of life Personal safety and security 17 17 0 aspects as drivers of happiness Social status 6 6 0 Access to news/information 29 29 0 among women and men Exercising/physical activities 20 19 -1 (based on correlation between Country's social/political situation 28 27 -1 Feeling in control of my life 3 1 -2 satisfaction with each aspect of Co-workers 22 20 -2 life and reported happiness) Job 16 14 -2 Material possessions 11 9 -2 Social life 4 2 -2 Feeling free to do and say what I want 13 10 -3 Amount of free time 27 24 -3 Country's economic situation 26 23 -3 Feeling appreciated 8 4 -4 Relationship with relatives 25 21 -4 More important to men’s happiness Own financial situation 9 3 -6
Happiness and consumer confidence are highly correlated 100% R² = 0.7622 90% China India Saudi Arabia Brazil 80% Mexico Australia South Africa Sweden United States % Happy Argentina France Canada (very/rather) 70% Great Britain Spain Italy Germany Turkey Belgium 60% Japan Poland South Korea 50% Hungary 40% 30.0 35.0 40.0 45.0 50.0 55.0 60.0 65.0 70.0 75.0 Ipsos Consumer Confidence Index
4 Challenging experiences
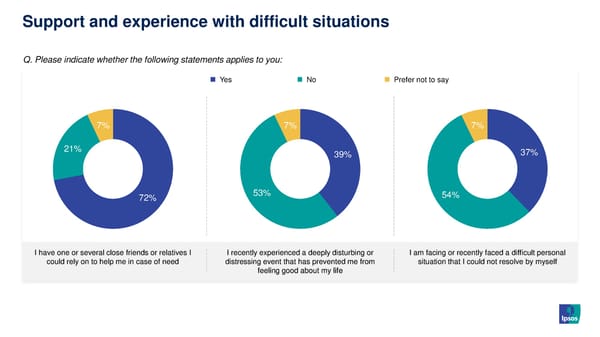
Support and experience with difficult situations Q. Please indicate whether the following statements applies to you: Yes No Prefer not to say 7% 7% 7% 21% 39% 37% 72% 53% 54% I have one or several close friends or relatives I I recently experienced a deeply disturbing or I am facing or recently faced a difficult personal could rely on to help me in case of need distressing event that has prevented me from situation that I could not resolve by myself feeling good about my life
Average: 72% Access to Netherlands 82% Male 70% Indonesia 79% Portugal 79% Female 73% support in Poland 77% Argentina 77% case of need Saudi Arabia 76% Gen Z 69% Colombia 76% Millennial 71% Malaysia 75% United Arab Emirates 75% Gen X 71% Australia 74% Boomer 77% Mexico 74% Peru 74% Chile 73% Married 75% Spain 73% Thailand 73% Other 69% Q. Please indicate whether the Hungary 73% following statements applies to you: Belgium 72% South Africa 72% Lower income 64% I have one or several close friends or Germany 72% Middle income 73% relatives I could rely on to help me in Turkey 72% case of need Canada 71% Upper income 76% China 71% (% Yes) Great Britain 71% United States 71% Lower education 68% Sweden 70% Medium education 71% Italy 70% France 69% Higher education 75% India 68% Singapore 67% South Korea 61% Employed 73% Brazil 58% Non-employed 70% Japan 54%

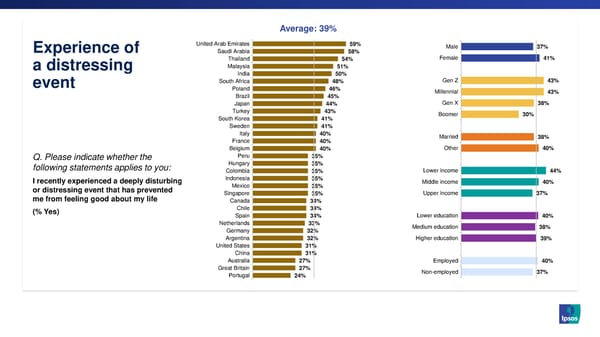
Average: 39% Experience of United Arab Emirates 59% Male 37% Saudi Arabia 58% Thailand 54% Female 41% a distressing Malaysia 51% India 50% event South Africa 48% Gen Z 43% Poland 46% Millennial 43% Brazil 45% Japan 44% Gen X 38% Turkey 43% Boomer 30% South Korea 41% Sweden 41% Italy 40% Married 38% France 40% Belgium 40% Other 40% Q. Please indicate whether the Peru 35% following statements applies to you: Hungary 35% Colombia 35% Lower income 44% I recently experienced a deeply disturbing Indonesia 35% Middle income 40% or distressing event that has prevented Mexico 35% me from feeling good about my life Singapore 35% Upper income 37% Canada 34% (% Yes) Chile 34% Spain 34% Lower education 40% Netherlands 33% Medium education 38% Germany 32% Argentina 32% Higher education 39% United States 31% China 31% Australia 27% Employed 40% Great Britain 27% Non-employed 37% Portugal 24%
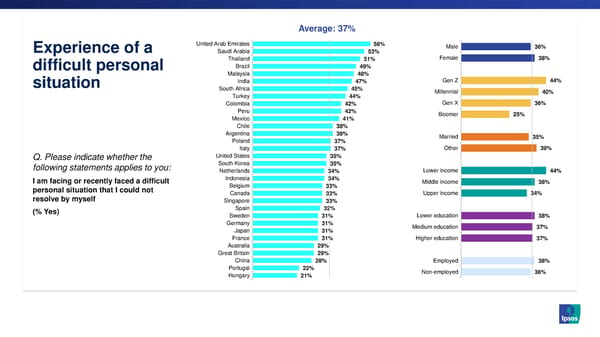
Average: 37% Experience of a United Arab Emirates 56% Male 36% Saudi Arabia 53% Thailand 51% Female 38% difficult personal Brazil 49% Malaysia 48% situation India 47% Gen Z 44% South Africa 45% Millennial 40% Turkey 44% Colombia 42% Gen X 36% Peru 42% Boomer 25% Mexico 41% Chile 38% Argentina 38% Married 35% Poland 37% Italy 37% Other 39% Q. Please indicate whether the United States 35% following statements applies to you: South Korea 35% Netherlands 34% Lower income 44% I am facing or recently faced a difficult Indonesia 34% Middle income 38% personal situation that I could not Belgium 33% resolve by myself Canada 33% Upper income 34% Singapore 33% (% Yes) Spain 32% Sweden 31% Lower education 38% Germany 31% Medium education 37% Japan 31% France 31% Higher education 37% Australia 29% Great Britain 29% China 28% Employed 38% Portugal 22% Non-employed 36% Hungary 21%
5 Expectations about the future of relationships
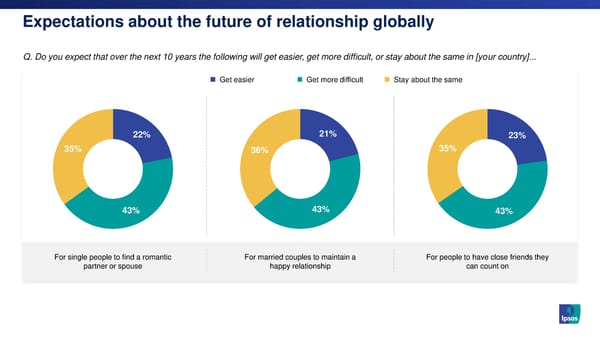
Expectations about the future of relationship globally Q. Do you expect that over the next 10 years the following will get easier, get more difficult, or stay about the same in [your country]... Get easier Get more difficult Stay about the same 22% 21% 23% 35% 36% 35% 43% 43% 43% For single people to find a romantic For married couples to maintain a For people to have close friends they partner or spouse happy relationship can count on
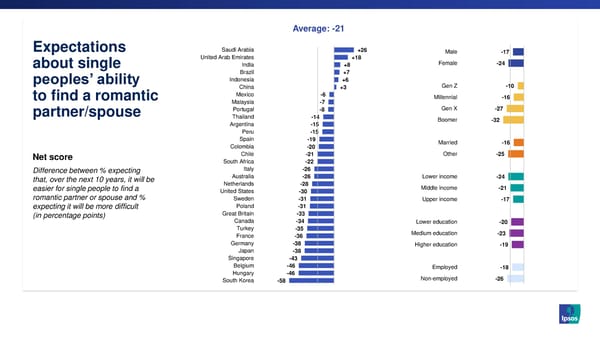
Average: -21 Expectations Saudi Arabia +26 Male -17 United Arab Emirates +18 about single India +8 Female -24 Brazil +7 Indonesia +6 peoples’ ability China +3 Gen Z -10 to find a romantic Mexico -6 Millennial -16 Malaysia -7 partner/spouse Portugal -8 Gen X -27 Thailand -14 Boomer -32 Argentina -15 Peru -15 Spain -19 Married -16 Colombia -20 Net score Chile -21 Other -25 South Africa -22 Difference between % expecting Italy -26 that, over the next 10 years, it will be Australia -26 Lower income -24 easier for single people to find a Netherlands -28 Middle income -21 romantic partner or spouse and % United States -30 Sweden -31 Upper income -17 expecting it will be more difficult Poland -31 (in percentage points) Great Britain -33 Canada -34 Lower education -20 Turkey -35 Medium education -23 France -36 Germany -38 Higher education -19 Japan -38 Singapore -43 Belgium -46 Employed -18 Hungary -46 Non-employed -26 South Korea -58
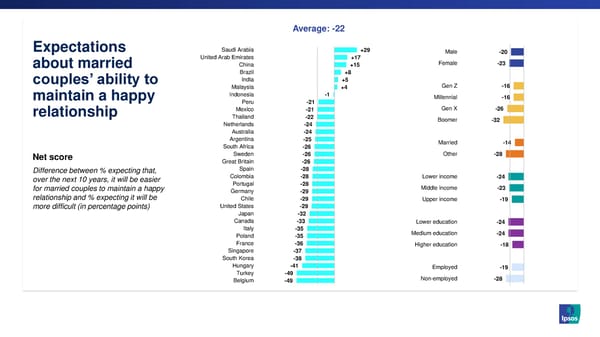
Average: -22 Expectations Saudi Arabia +29 Male -20 United Arab Emirates +17 about married China +15 Female -23 Brazil +8 India +5 couples’ ability to Malaysia +4 Gen Z -16 maintain a happy Indonesia -1 Millennial -16 Peru -21 relationship Mexico -21 Gen X -26 Thailand -22 Boomer -32 Netherlands -24 Australia -24 Argentina -25 Married -14 South Africa -26 Net score Sweden -26 Other -28 Great Britain -26 Difference between % expecting that, Spain -28 over the next 10 years, it will be easier Colombia -28 Lower income -24 for married couples to maintain a happy Portugal -28 Middle income -23 relationship and % expecting it will be Germany -29 Chile -29 Upper income -19 more difficult (in percentage points) United States -29 Japan -32 Canada -33 Lower education -24 Italy -35 Medium education -24 Poland -35 France -36 Higher education -18 Singapore -37 South Korea -38 Hungary -41 Employed -19 Turkey -49 Non-employed -28 Belgium -49
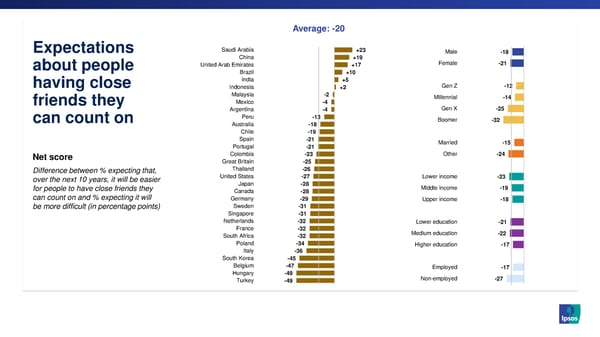
Average: -20 Expectations Saudi Arabia +23 Male -18 China +19 about people United Arab Emirates +17 Female -21 Brazil +10 India +5 having close Indonesia +2 Gen Z -12 Malaysia -2 Millennial -14 friends they Mexico -4 Argentina -4 Gen X -25 can count on Peru -13 Boomer -32 Australia -18 Chile -19 Spain -21 Married -15 Portugal -21 Net score Colombia -23 Other -24 Great Britain -25 Difference between % expecting that, Thailand -26 over the next 10 years, it will be easier United States -27 Lower income -23 for people to have close friends they Japan -28 Middle income -19 can count on and % expecting it will Canada -28 Germany -29 Upper income -18 be more difficult (in percentage points) Sweden -31 Singapore -31 Netherlands -32 Lower education -21 France -32 Medium education -22 South Africa -32 Poland -34 Higher education -17 Italy -36 South Korea -45 Belgium -47 Employed -17 Hungary -49 Non-employed -27 Turkey -49
Methodology • These are the findings of a 32-country Ipsos survey conducted December 22, 2022 • Prior fieldwork waves were also conducted on Ipsos’s Global Advisor online survey –January 6, 2023, among 22,508 adults aged 18-74 in the United States, Canada, platform: Malaysia, South Africa, and Turkey, 20-74 in Thailand, 21-74 in Indonesia and – Nov 19 – Dec 3, 2021, among 20,504 adults in 30 countries Singapore, and 16-74 in 24 other countries, via Ipsos’s Global Advisor online – Jul 24 – Aug 7, 2020, among 19,516 adults in 27 countries survey platform. – May 24 – Jun 7, 2019, among 20,327 adults in 28 countries • Each country’s sample consists of ca. 2,000 individuals in Japan; 1,000 individuals – Jan 26 – Feb 9, 2018, among 19,428 adults in 27 countries in each of Australia, Brazil, Canada, China (mainland), France, Germany, Great Britain, Italy, Spain, and the U.S.; and ca. 500 individuals – Feb 17 – Mar 3, 2017, among 18,523 adults in 26 countries in each of Argentina, Belgium, Chile, Colombia, Hungary, India, Indonesia, – May 7 – 21, 2013, among 18,513 adults in 25 countries Malaysia, Mexico, the Netherlands, Peru, Poland, Portugal, Saudi Arabia, – Dec 6 – 19, 2011, among 21,245 adults in 24 countries Singapore, South Africa, South Korea, Sweden, Thailand, Turkey, and the United Arab Emirates. • The data is weighted so that each market’s sample composition best reflects • The samples in Argentina, Australia, Belgium, Canada, France, Germany, the demographic profile of the adult population according to the most recent census Great Britain, Hungary, Italy, Japan, the Netherlands, Poland, South Korea, data. Spain, Sweden, Switzerland, and the U.S. can be taken as representative • The Global average reflects the average result of all the countries and markets where the survey was conducted that year. It has not been adjusted to the of these countries’ general adult population under the age of 75. population size of each country or market and is not intended to suggest • The samples in Brazil, Chile, China, Colombia, India, Indonesia, Malaysia, Mexico, a total result. Peru, Saudi Arabia, Singapore, South Africa, Thailand, Turkey, • Where results do not sum to 100 or the ‘difference’ appears to be +/-1 more/less and the UAE are more urban, more educated, and/or more affluent than than the actual, this may be due to rounding, multiple responses the general population. The survey results for these markets should be viewed or the exclusion of don't knows or not stated responses. as reflecting the views of the more “connected” segment of their population. • The precision of Ipsos online polls is calculated using a credibility interval with a poll of 1,000 accurate to +/- 3.5 percentage points and of 500 accurate to +/- 4.8 percentage points. For more information on Ipsos’s use of credibility intervals, please visit the Ipsos website. • The publication of these findings abides by local rules and regulations.
About Ipsos Game Changers Ipsos is the third largest market research company in the world, In our world of rapid change, the need for reliable information present in 90 markets and employing more than 18,000 people. to make confident decisions has never been greater. Our research professionals, analysts and scientists have built At Ipsos we believe our clients need more than a data supplier, they unique multi-specialist capabilities that provide powerful insights need a partner who can produce accurate and relevant information into the actions, opinions and motivations of citizens, consumers, and turn it into actionable truth. patients, customers or employees. Our 75 business solutions are This is why our passionately curious experts not only provide the based on primary data coming from our surveys, social media most precise measurement, but shape it to provide True monitoring, and qualitative or observational techniques. Understanding of Society, Markets and People. “Game Changers” – our tagline – summarises our ambition to help To do this we use the best of science, technology and know-how our 5,000 clients to navigate more easily our deeply changing world. and apply the principles of security, simplicity, speed and substance Founded in France in 1975, Ipsos is listed on the Euronext Paris to everything we do. since July 1st, 1999. The company is part of the SBF 120 and the So that our clients can act faster, smarter and bolder. Mid-60 index and is eligible for the Deferred Settlement Service (SRD). Ultimately, success comes down to a simple truth: ISIN code FR0000073298, Reuters ISOS.PA, Bloomberg IPS:FP You act better whenyou are sure. www.ipsos.com
Contact for more information Nicolas Boyon Senior Vice President, US Public Affairs, Ipsos nicolas.boyon@ipsos.com