
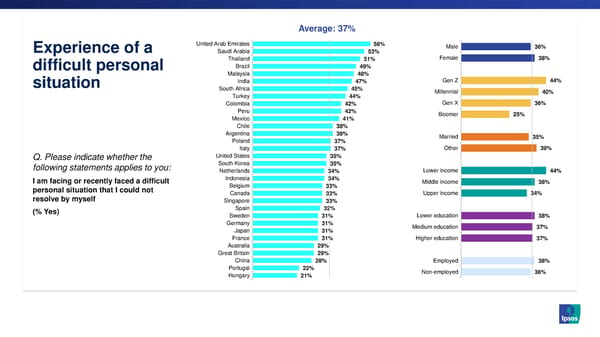
Average: 37% Experience of a United Arab Emirates 56% Male 36% Saudi Arabia 53% Thailand 51% Female 38% difficult personal Brazil 49% Malaysia 48% situation India 47% Gen Z 44% South Africa 45% Millennial 40% Turkey 44% Colombia 42% Gen X 36% Peru 42% Boomer 25% Mexico 41% Chile 38% Argentina 38% Married 35% Poland 37% Italy 37% Other 39% Q. Please indicate whether the United States 35% following statements applies to you: South Korea 35% Netherlands 34% Lower income 44% I am facing or recently faced a difficult Indonesia 34% Middle income 38% personal situation that I could not Belgium 33% resolve by myself Canada 33% Upper income 34% Singapore 33% (% Yes) Spain 32% Sweden 31% Lower education 38% Germany 31% Medium education 37% Japan 31% France 31% Higher education 37% Australia 29% Great Britain 29% China 28% Employed 38% Portugal 22% Non-employed 36% Hungary 21%
 Global Happiness 2023 Page 24 Page 26