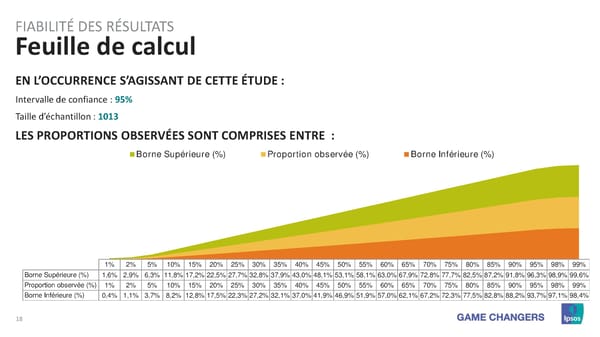
FIABILITÉ DES RÉSULTATS Feuille de calcul EN L’OCCURRENCE S’AGISSANT DE CETTE ÉTUDE : Intervalle de confiance : 95% Taille d’échantillon : 1013 LES PROPORTIONS OBSERVÉES SONT COMPRISES ENTRE : Borne Supérieure (%) Proportion observée (%) Borne Inférieure (%) 1% 2% 5% 10% 15% 20% 25% 30% 35% 40% 45% 50% 55% 60% 65% 70% 75% 80% 85% 90% 95% 98% 99% Borne Supérieure (%) 1,6% 2,9% 6,3% 11,8% 17,2% 22,5% 27,7% 32,8% 37,9% 43,0% 48,1% 53,1% 58,1% 63,0% 67,9% 72,8% 77,7% 82,5% 87,2% 91,8% 96,3% 98,9% 99,6% Proportion observée (%) 1% 2% 5% 10% 15% 20% 25% 30% 35% 40% 45% 50% 55% 60% 65% 70% 75% 80% 85% 90% 95% 98% 99% Borne Inférieure (%) 0,4% 1,1% 3,7% 8,2% 12,8% 17,5% 22,3% 27,2% 32,1% 37,0% 41,9% 46,9% 51,9% 57,0% 62,1% 67,2% 72,3% 77,5% 82,8% 88,2% 93,7% 97,1% 98,4% 18
 Emmanuel Macron, un an: Le Bilan Page 17 Page 19